Stephanie Tabb
ARCH + TECH
tall tower design at som
Skidmore, Owings, and Merrill has produced 7 of the world’s 15 tallest and most iconic towers. With a rigorous design approach, legacy of innovation, and deep understanding of the forces that govern tall buildings, SOM sets the benchmark for tall tower design.
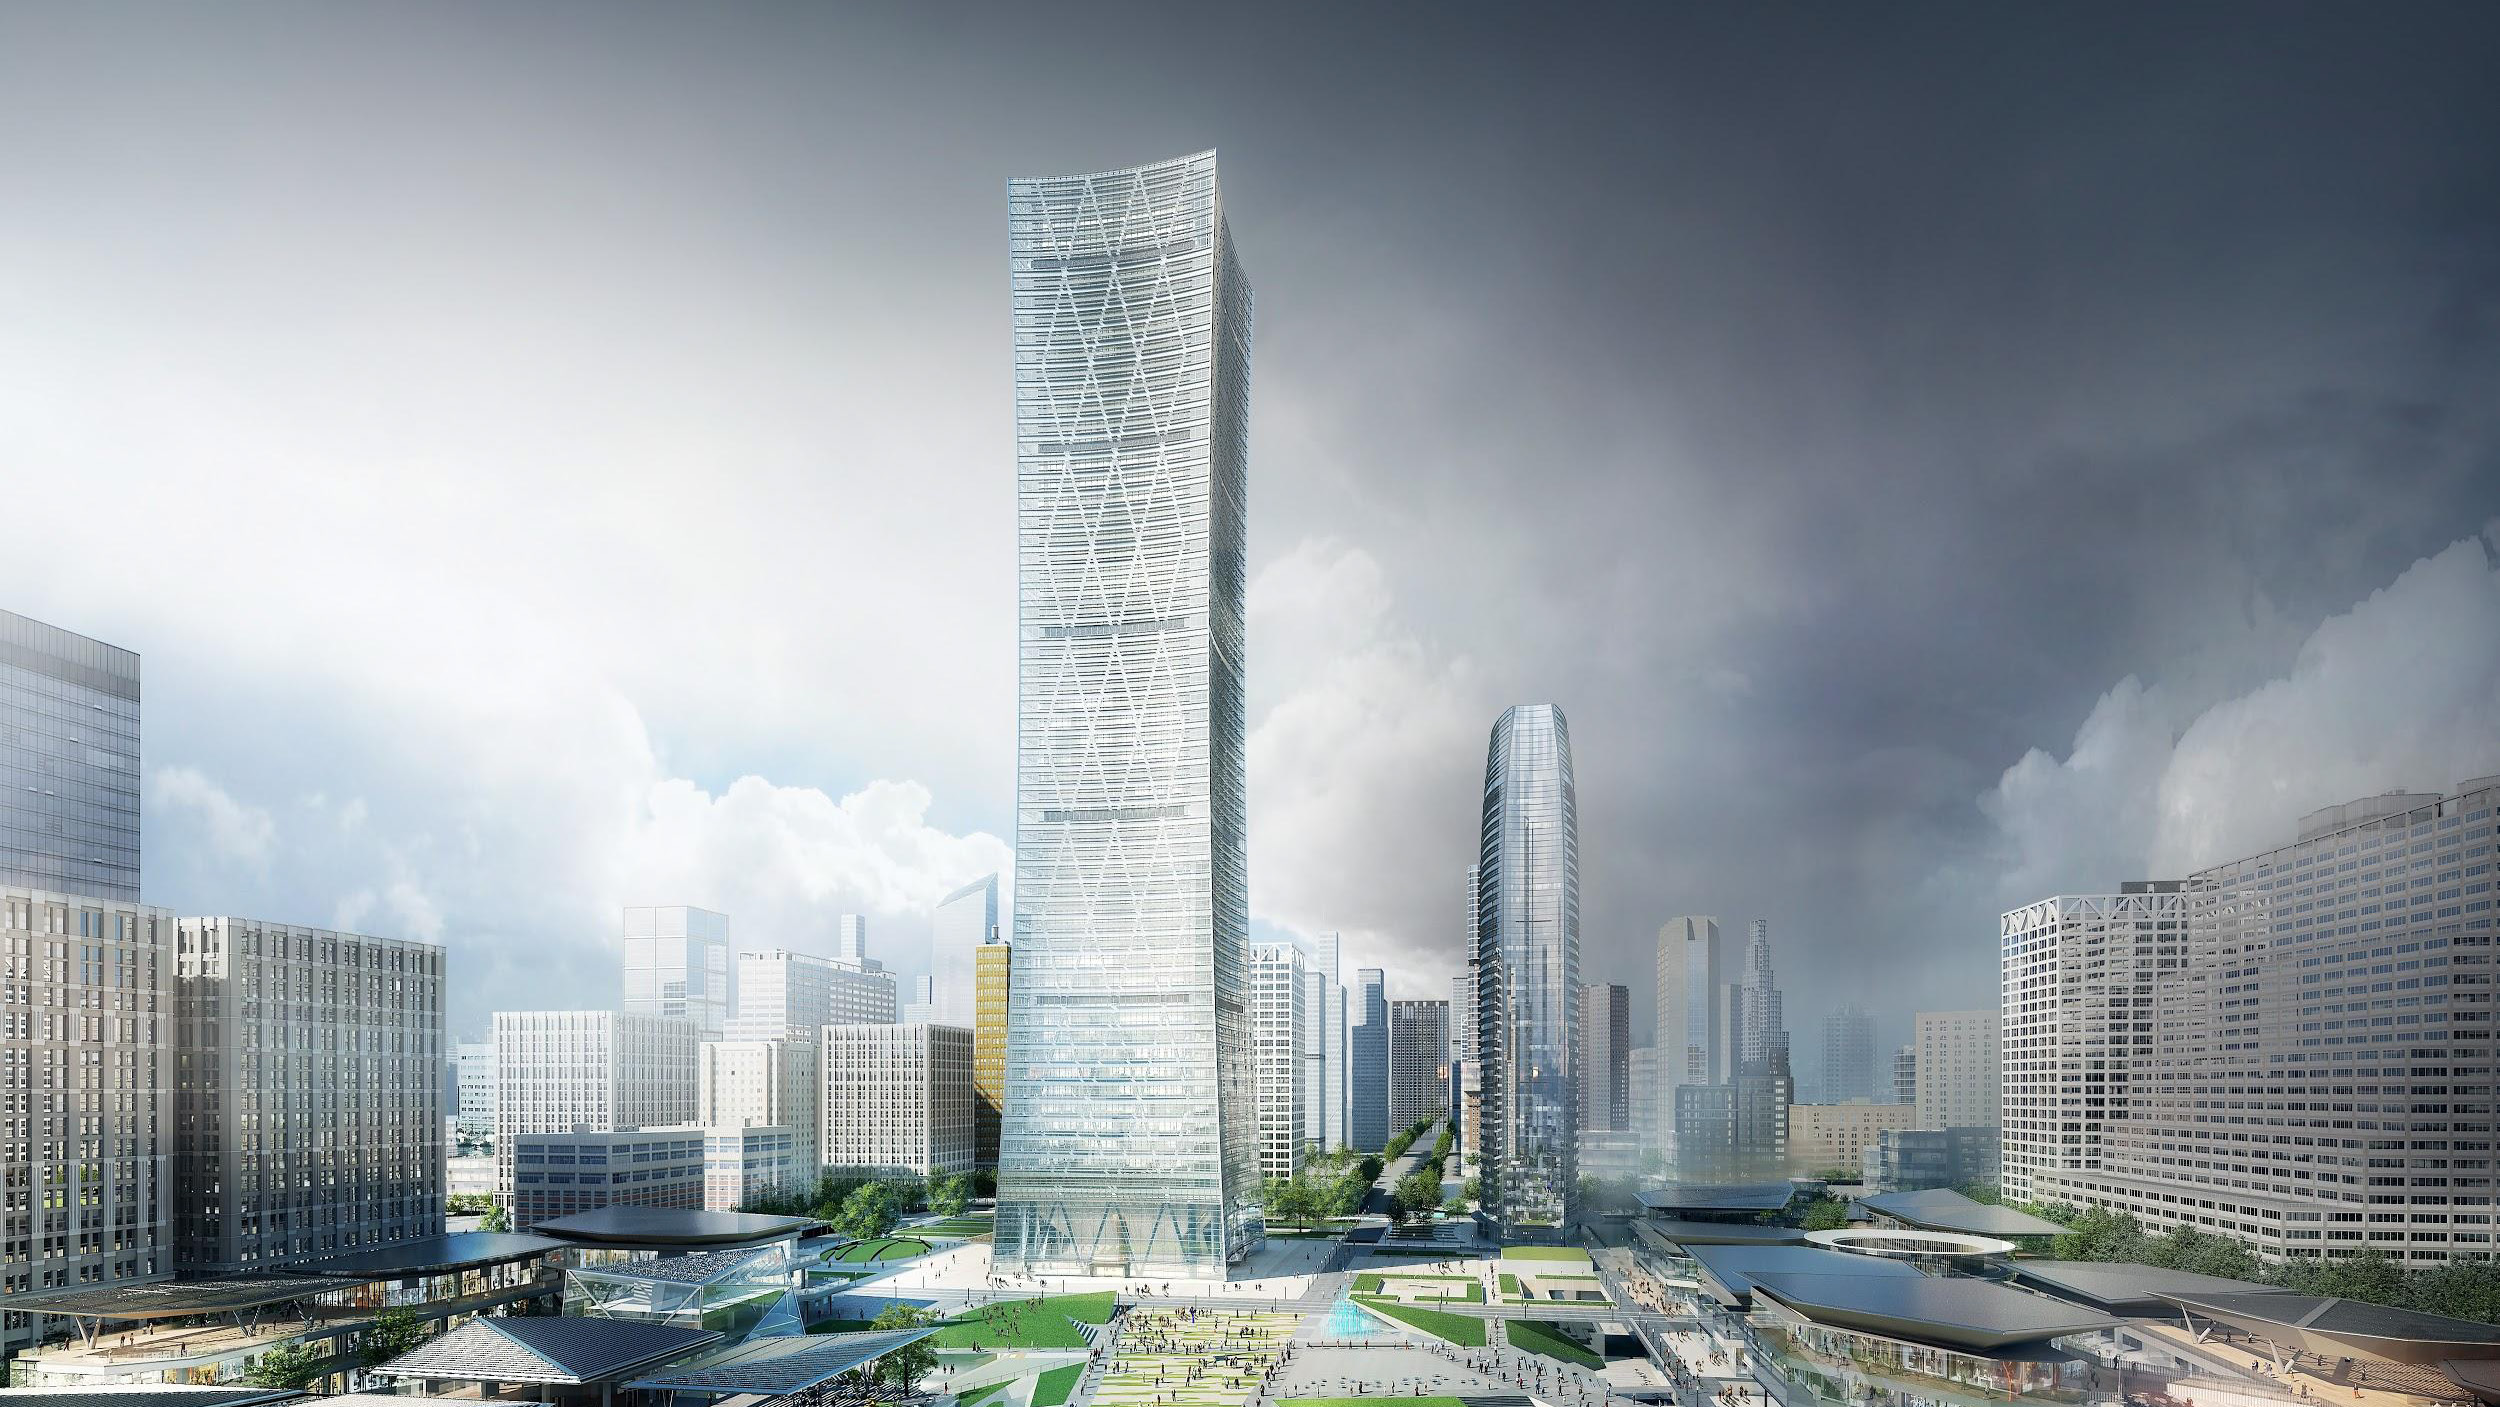
This 272m prototypical tall tower exemplifies SOM’s highly efficient collaboration and workflow.
design idea
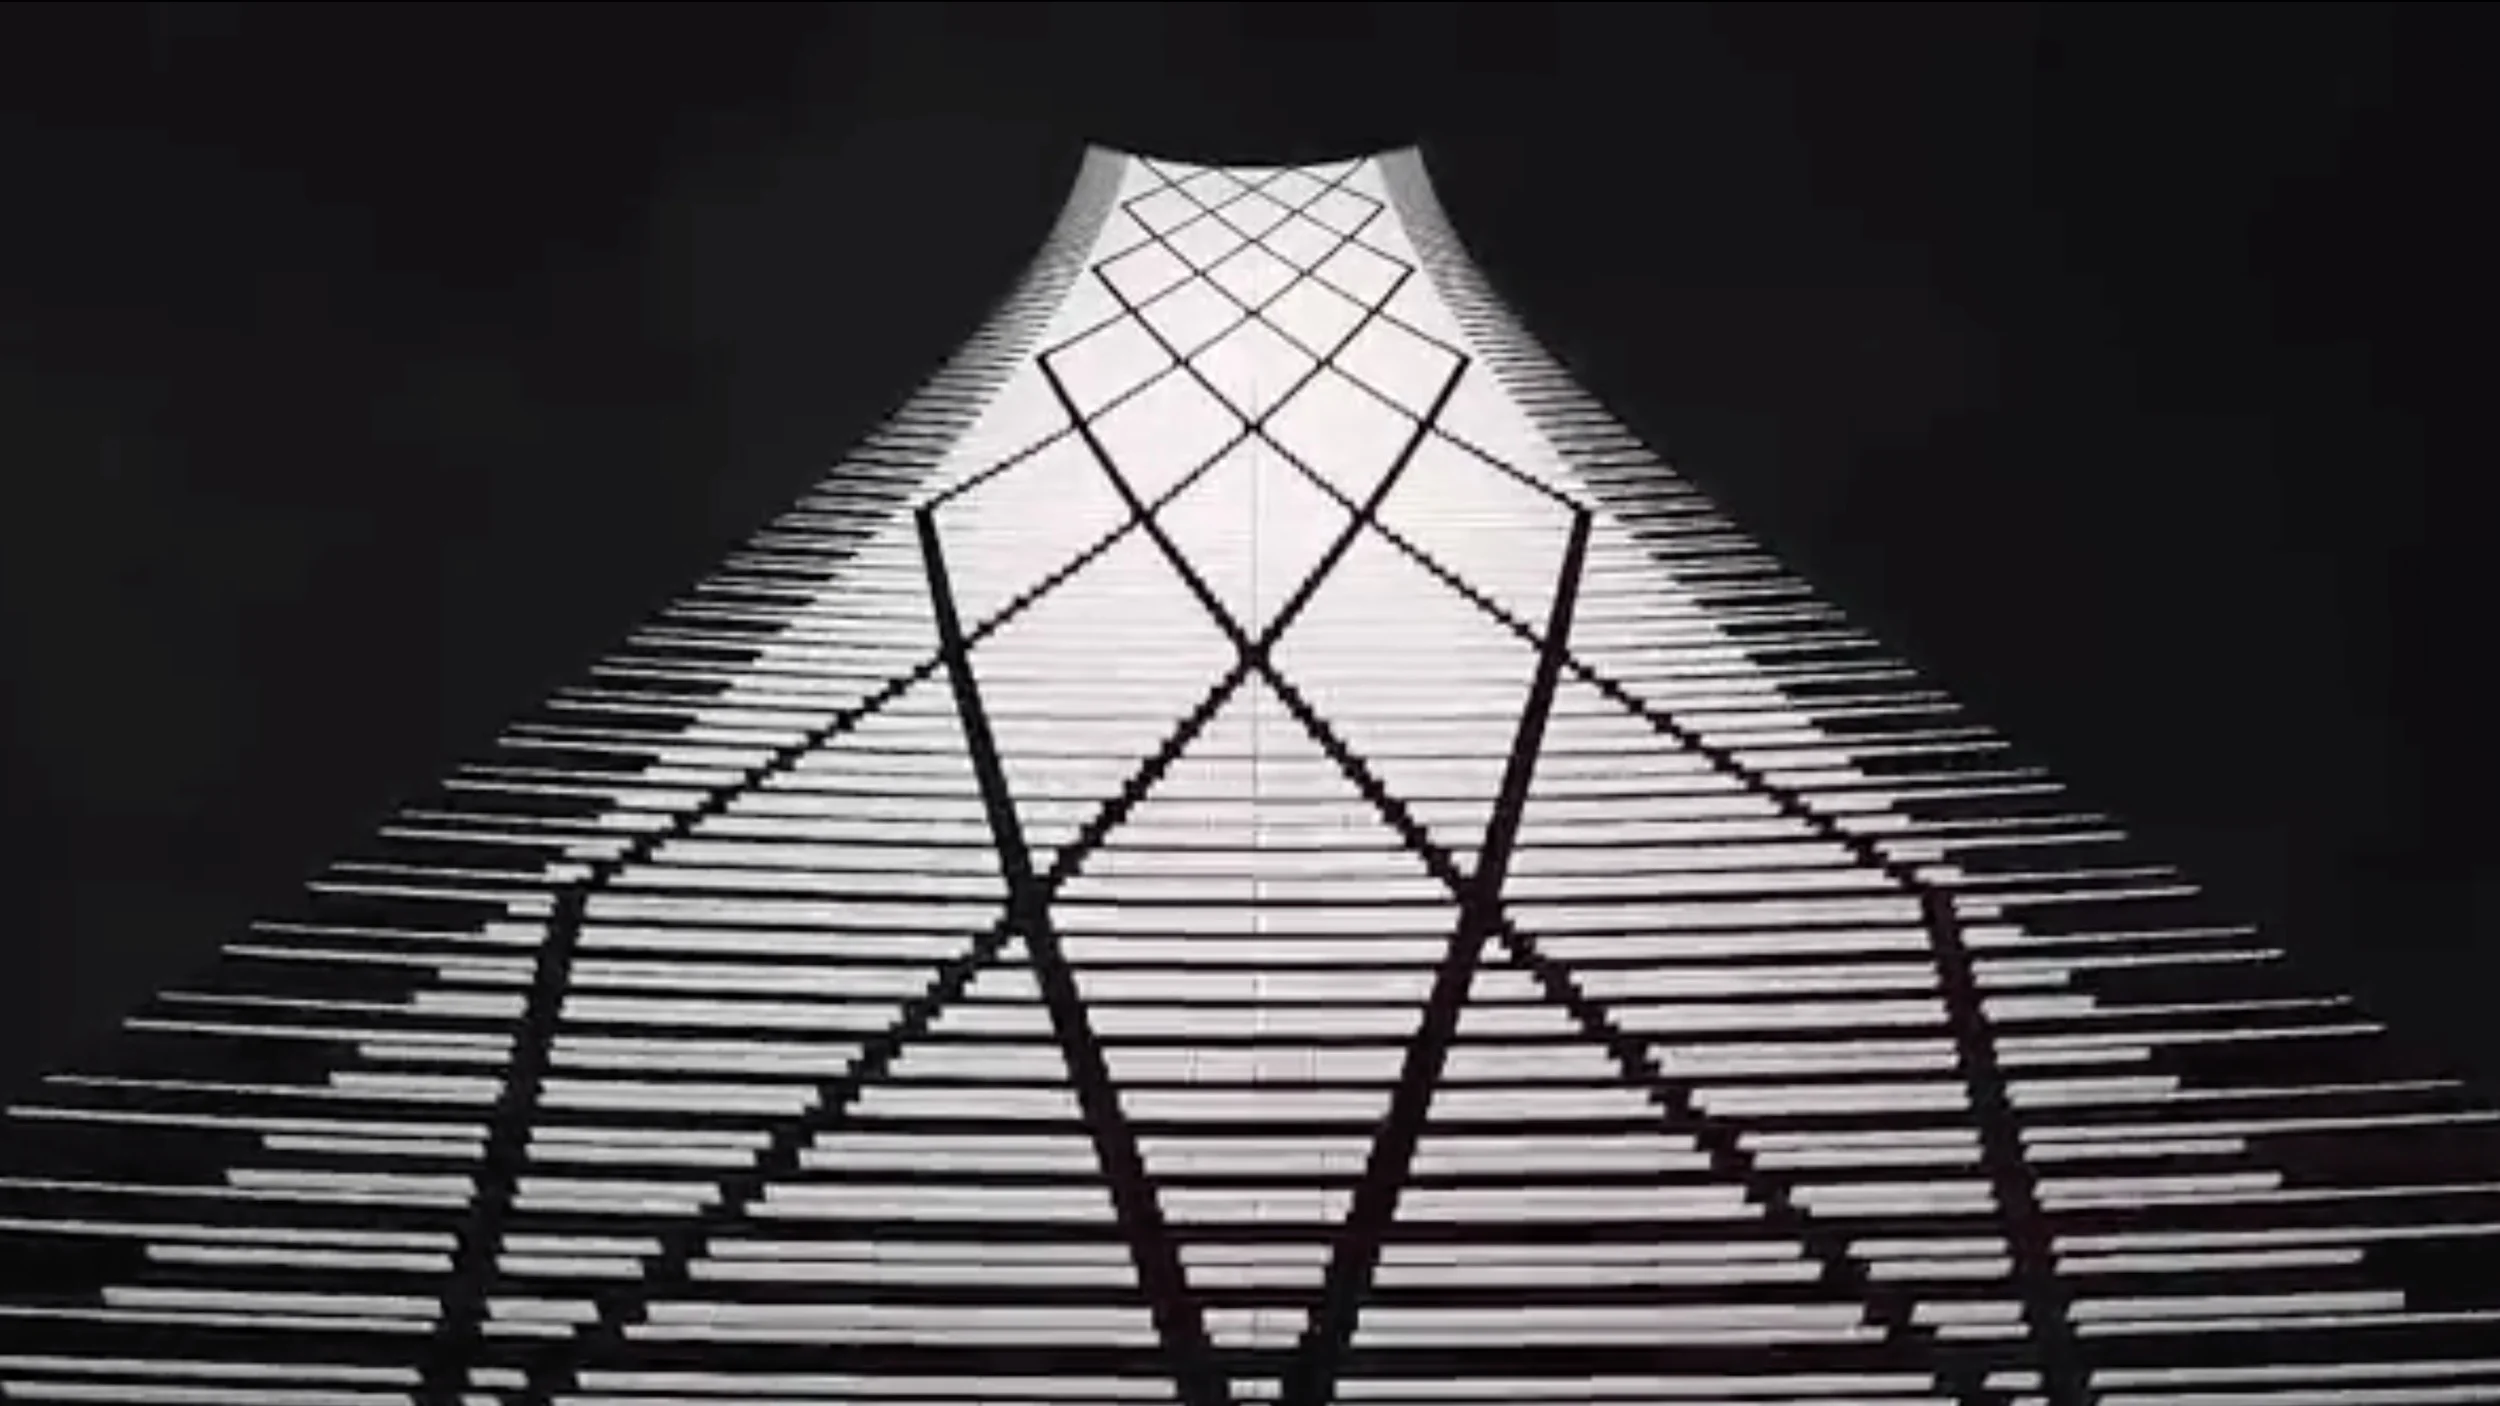
Flying eaves of traditional garden pavilions are reflected in the tower form. These gestural forms are reinterpreted through a contemporary lens to create a modern, cultural icon.
DEFINE PARAMETERS
Performance and Massing Strategies.
DIGITAL MODEL DEVELOPMENT
Don’t just build a model. Build a design system.
WORKFLOW
This type of geometry is quicker to generate in grasshopper than it is to create in Revit. Each design option takes only 36 seconds to run-- this includes 3D geometry, plans, elevations, sections, and diagrams.
Excel to Grasshopper workflow.
Grasshopper visual scripting is used to generate the tower geometry. Rhino is only used for visualization.
EXCEL: The input parameters are first determined in an excel file. Here, we defined variables including floor to floor heights, level elevations, panel information, and arc radii. These values are driving the form in rhino and grasshopper.
RHINO: Only the geometry centroid and core geometry are referenced from Rhino into Grasshopper.
GRASSHOPPER: The scripts are organized into multiple grasshopper files, connected with pack and unpack components. These definitions include 3D geometry generation as well as visualization tools (including sections, elevations, plans, and lease depth diagrams).
Top / Mid / Bottom Squares
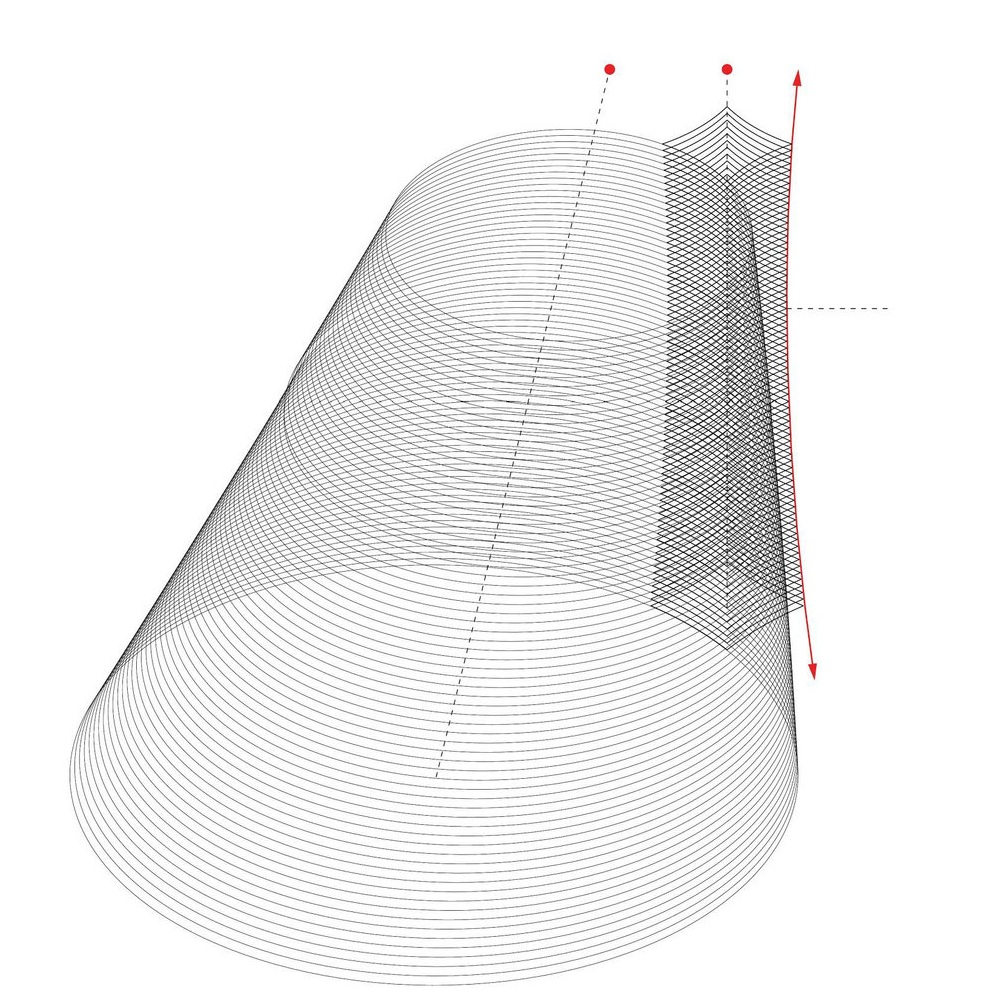
Tower Geometry Axonometric
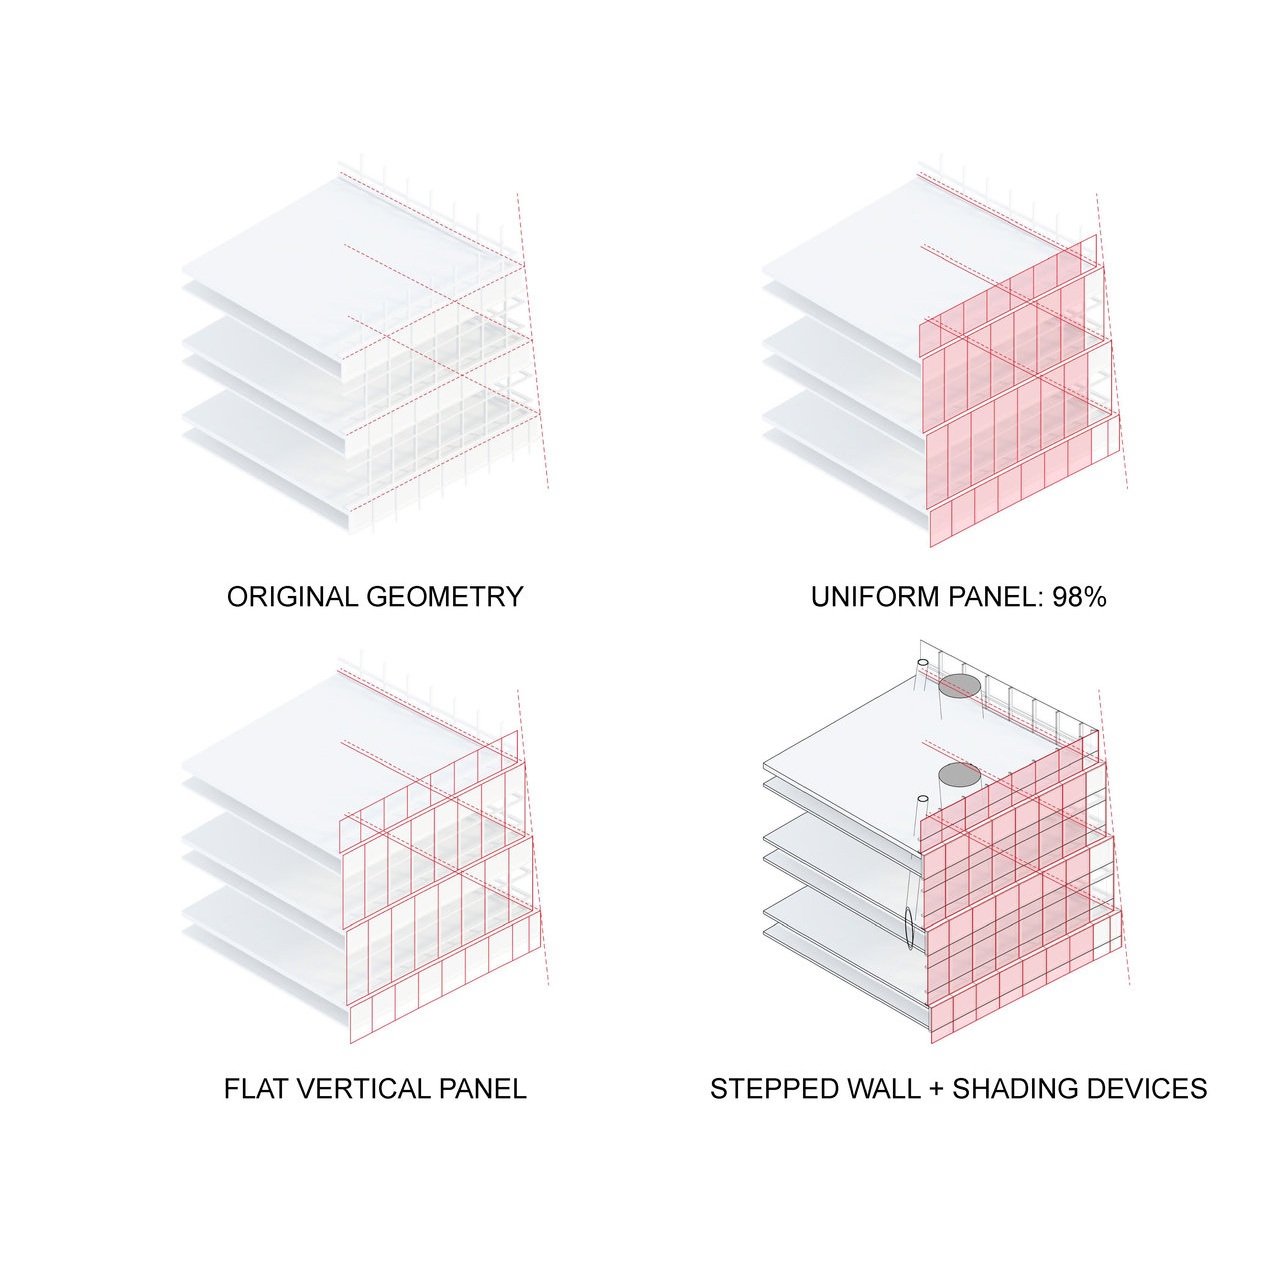
Facade Radius Varies per Level
ITERATION AND optimization
How do we strategically choose between infinite design options? What factors and tools allow us to make data-driven design decisions?
Throughout the design process, I engaged the team in interactive parametric design exercises. This allowed the team to make decisions in real time, instead of having a lag between design ideas and design decisions.
Check out this interactive model on web or mobile: https://app.shapediver.com/m/tall-tower-design-acbd-2019
LEASE DEPTH OPTIMIZATION
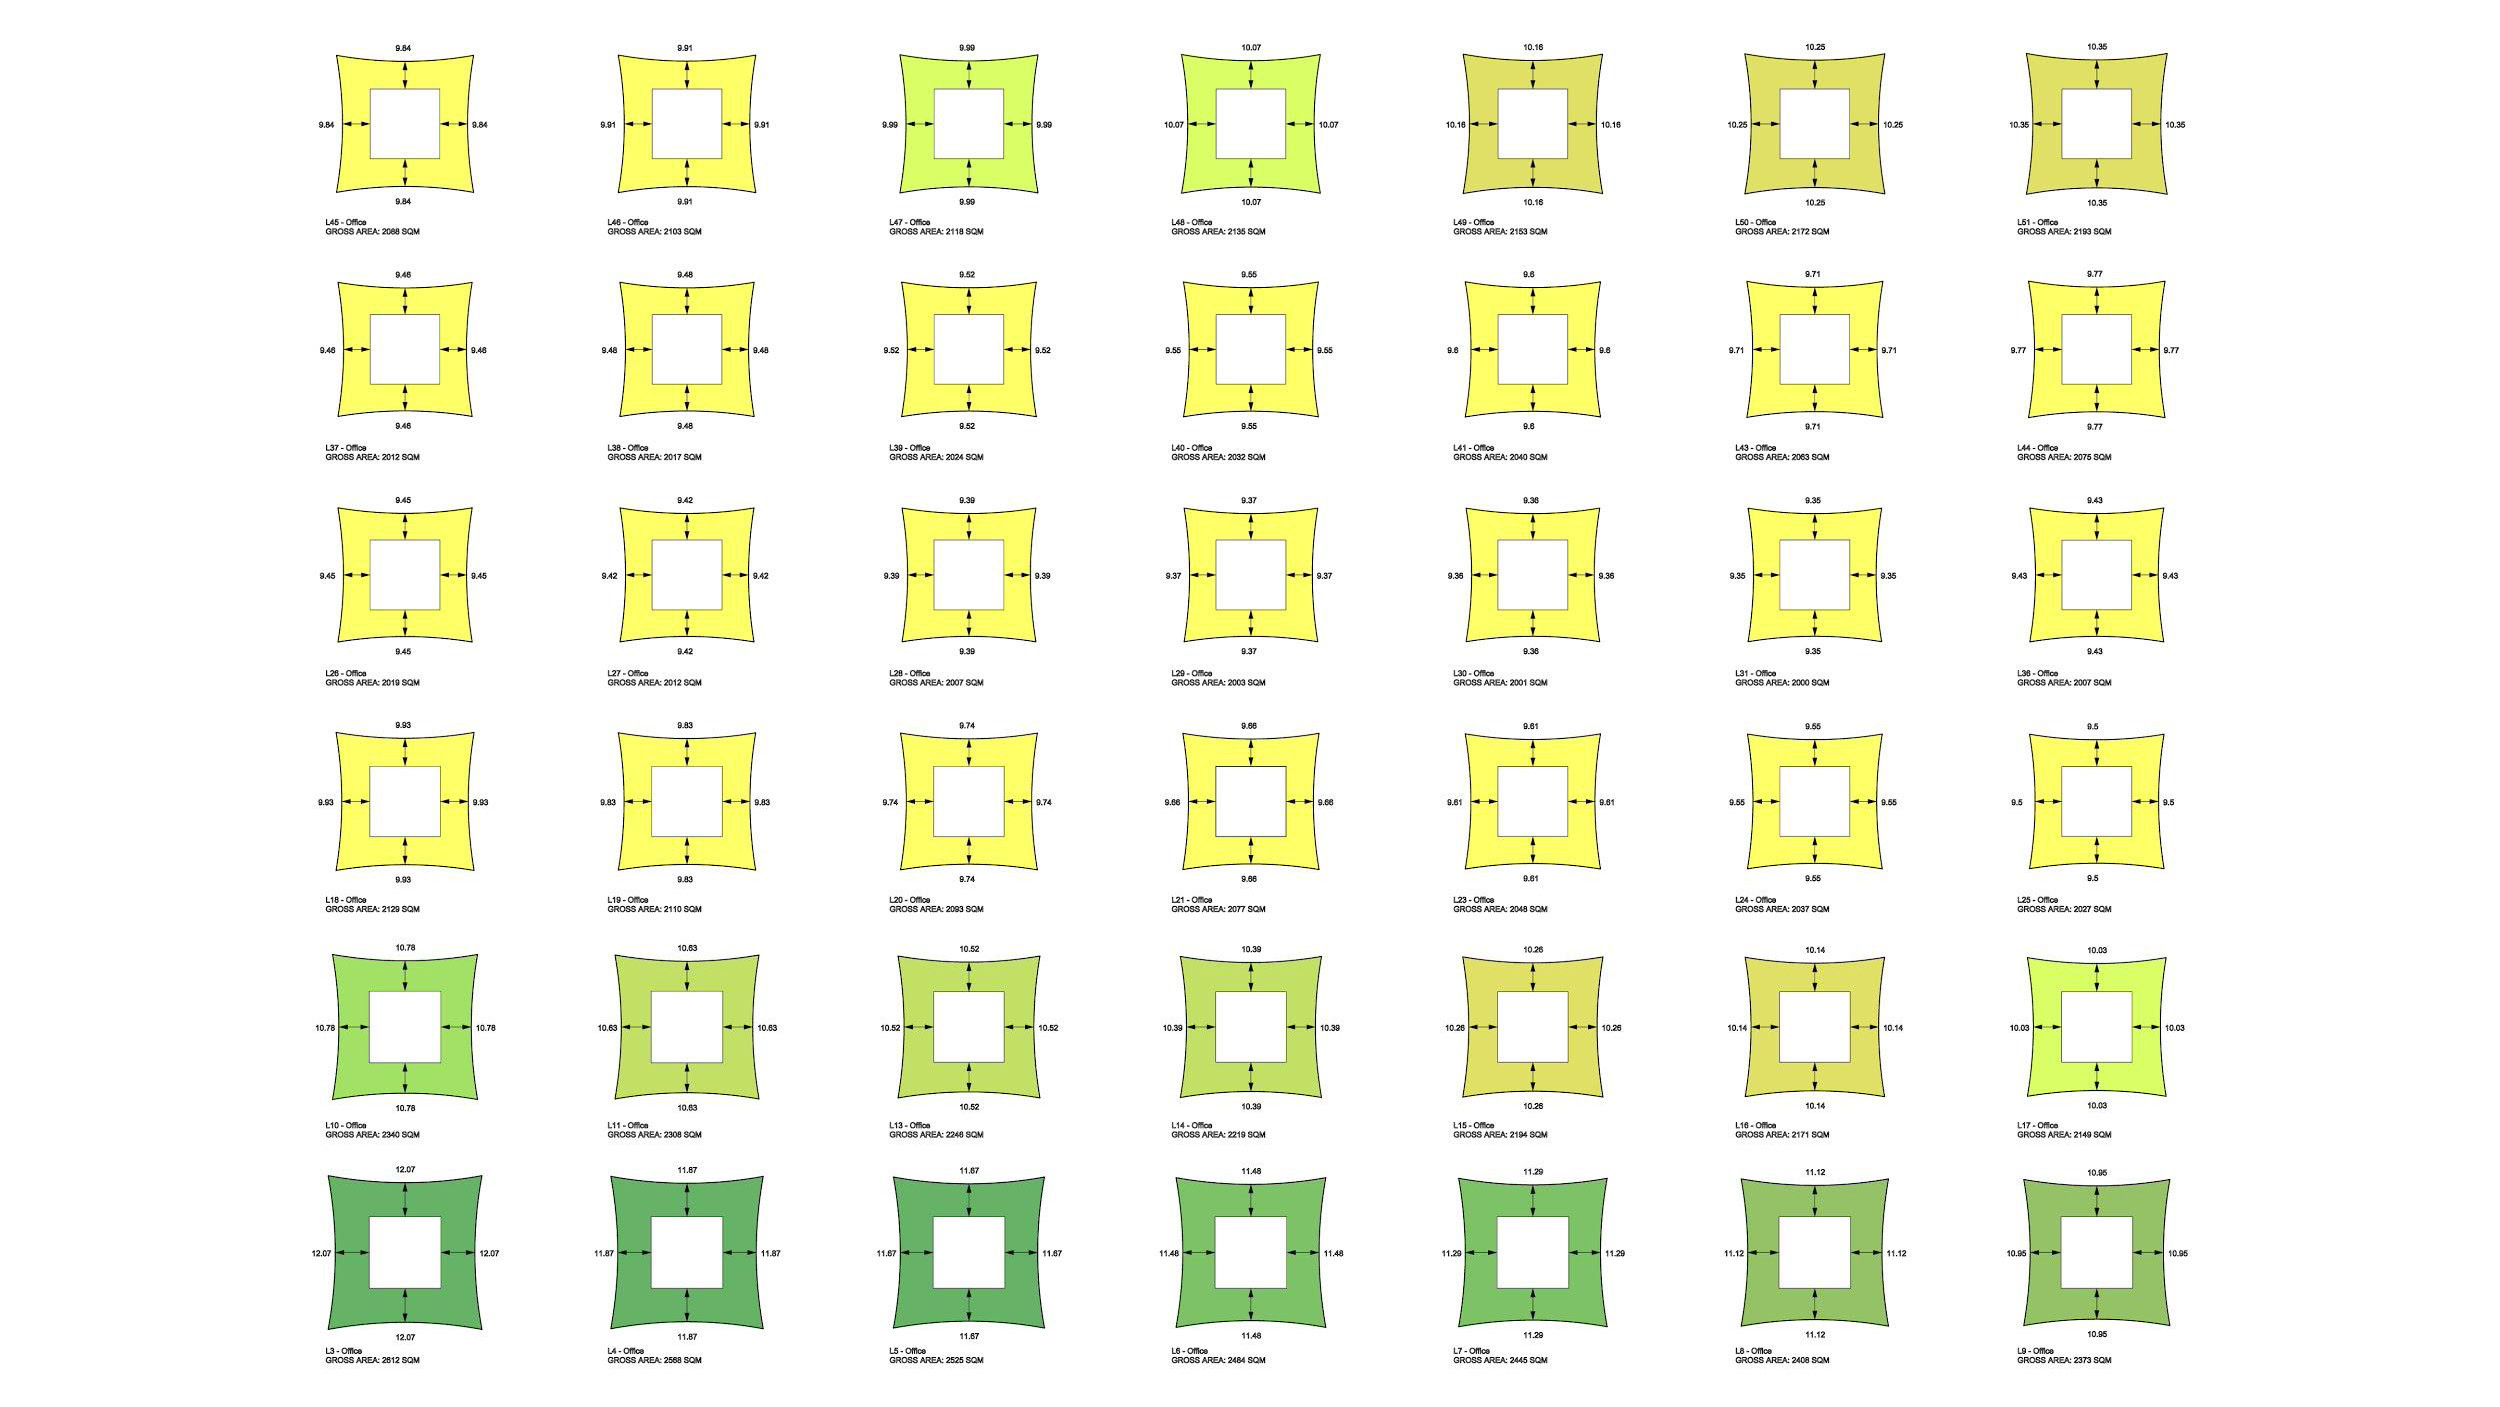
This cookie sheet analysis creates a floor by floor visualization of the office lease depths in the tower. This allows the design team to see the leaseable space between the core wall and the facade of the building for office tenants.
For this tower, we were concerned about the lease depths at the inflection point of the massing. The goal was to have the minimum lease depths to be a minimum of 10 meters. By seeing the calculations in real time, the team could understand the impact of various design decisions on the lease depths.
STRUCTURAL OPTIMIZATION
The structural nodes of the tower are straight from one to the next, while the facade is curved. This results in a variable distance between the structural members and the facade. I developed a tool to ensure that we could maintain proper clearance to the edge of slab. This has a direct impact on the usable area of the interior space, and is especially evident in the skylobby and lobby.
Skylobby Rendering
Lobby Rendering
MULTI-VARIABLE OPTIMIZATION
Design Explorer is a web-based user interface. Using Colibri add-in for Grasshopper, users can export data from a parametric model to an interactive dashboard. Users can refine the parameters and range of specific factors to narrow down the design space, and see 3D models of the designs.
USING OPTIMIZATION TO MAKE DATA-DRIVEN DESIGN DECISIONS
CONTINUOUS DATA PIPELINE
Interoperability: the efficient exchange of geometry and data between platforms
GEOMETRY DATA TRANSFER
The design geometry is built using a Excel / Rhino / Grasshopper workflow, but at the beginning of Design Development we needed to transfer the geometry into native Revit elements.
There are many methods for shifting geometry and data between Rhino and Revit, and each design element is migrated using the best method for its category type. The columns are transferred using Speckle (Grasshopper / Dynamo), the floors using mass floors, and the facade using a Grasshopper / Excel / custom SOM Revit add-in.
FACADE TYPES
FACADE DATA TRANSFER
FACADE REVIT FAMILIES


